- Have an immediate view on the Profitability of your Inward Businesses and Cedents by asking:
- What are the "Class of Business" (COB) Least Profitable?
- Which are the Cedents Most Profitable?
- What is the trend of the Claims-Premiums bookings along the time?
- Here you have a live model to explore by yourself.
- It offers four Analysis Dimensions :
- By Class of Business: Sector/Typology of Risk
- By Cedent: Cedent Company
- A flexible Decomposition Tree: The user choose freely the dimensions of decomposition
- Analytics:Pivot the Profitability along Time, Class of Business, Cedents
- Click the tabs for an overall view, then:
- Click the "Select By UWY" Filter to select an Underwriting Year .
- Click any graphical element inside a Visual to filter the other Visuals .
- Combine Filters and Selections to explore the data .
| These are the main Controls: | 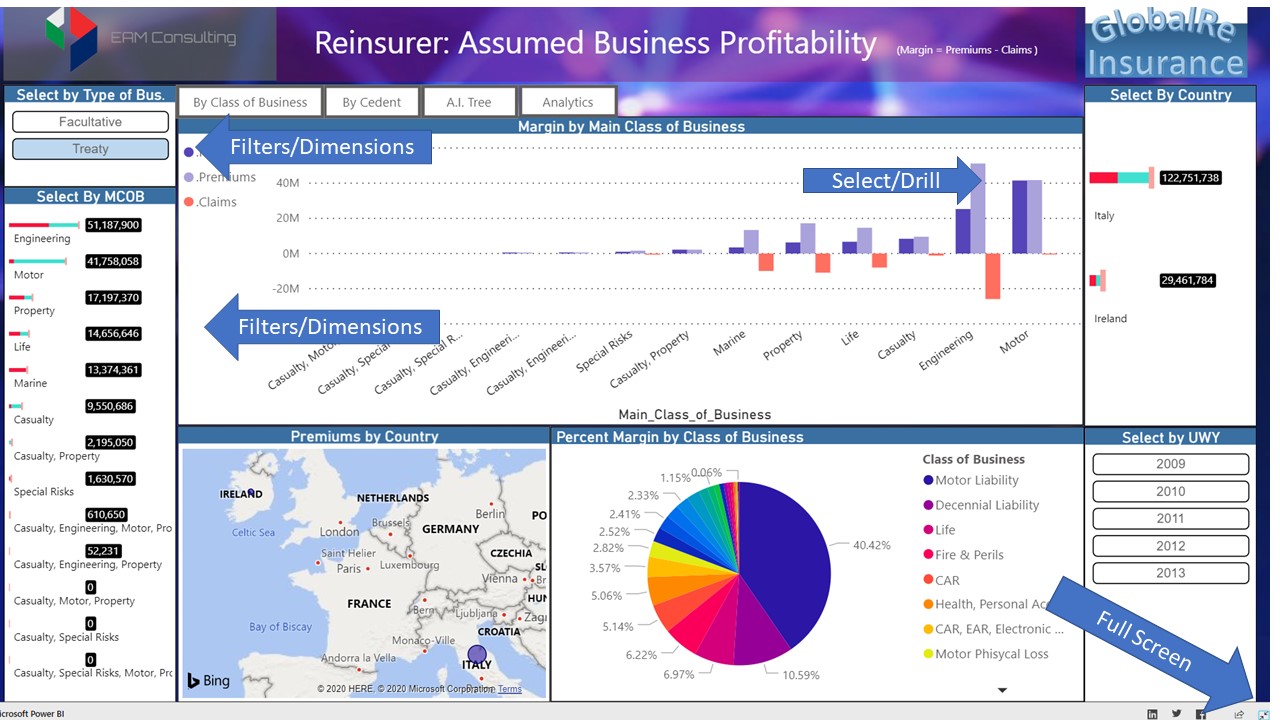 |
||
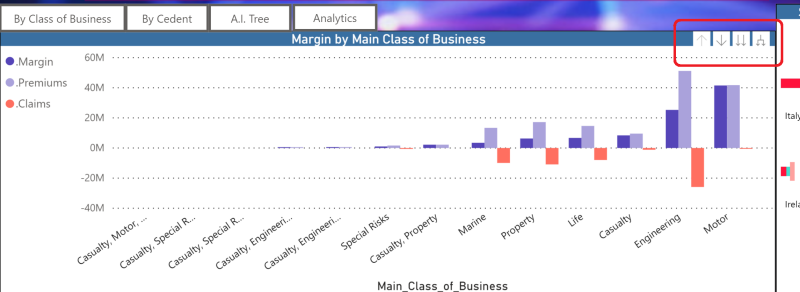
The main "Bar Graph" visuals at the center of the screen have two different behaviour
Note: Before click on the visual's area then on the "Down Arrow" icon. Click the other icons for different exploration modes in the visual itself. |
 |
||
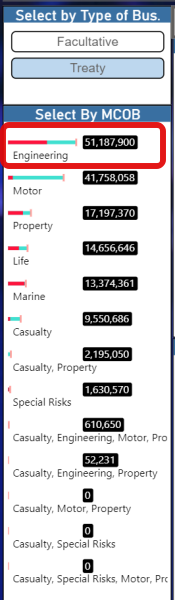
In some of the "Filtering Visuals" the Claims-Premium Quantity is represented by the bar colors:
|
 |