- Have an instant overview of the resources and answer to questions like:
- What is the Personell Type and distribution among Countries, Departments, period ?
- What are the Costs of the resources by Variable part, Allowances, Bonus etc.?
- What is the ratio of Sickleave by Organization and Gender?
- The dashboard offer six analysis pages:
- Summary: Headcount and Costs
- Functions: Departments per Country and Type of Employee
- Status: Offshore/Onshore, Expats/Inpats, Leavers/Starters
- Sickness: Maternal/Paternal,Sickness, Workable Hours
- Compensation: Salary, Variable, Benefit, Allowance,Pension
- Training: E-Learning or Classroom per Gender and Type
- Click the page buttons for an overall view, then:
- Click the "Month" or "Country" to filter single Month or Country.
- Click any graphical element inside a Visual to filter the other Visuals .
- Combine Filters and Selections to explore the data .
| These are the main Controls: | 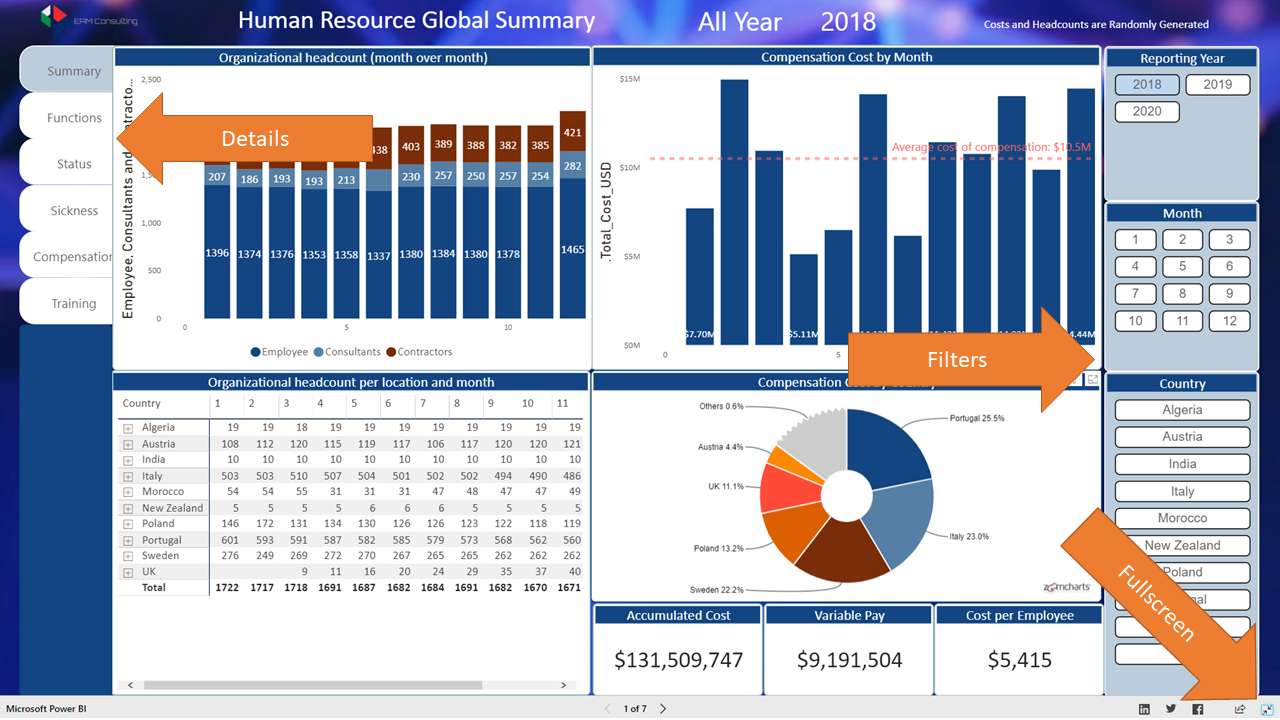 |
||
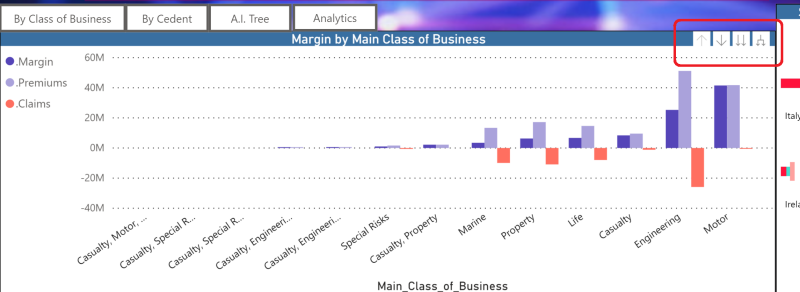
Some of the main visuals at the center of the screen have two different behaviour
Note: Before click on the visual's area then on the "Down Arrow" icon. Click the other icons for different exploration modes in the visual itself. |
 |